Changes in Exonic Splicing Regulatory Elements
Summary
- Skippy uses the Neighborhood Inference (NI) set of ESE/ESS hexamers for all analyses involving ESRs
- SAVs are in general characterized by losses of ESEs and/or gains of ESSs and generally deficient in gains of ESEs
- SAVs are further characterized by the extent of ESE losses/ESS gains (i.e. the greater the number of changes, the more likely it is to be an SAV)
- Skippy provides a measure of how likely a combination of ESR changes is associated with SAVs, termed the LOR (Log Odds Ratio) score
- Specific ESR changes such as direct changes from ESEs to ESSs are particularly enriched in SAVs
One of the main mechanisms by which SAVs are thought to cause exon-skipping is by changes in regulatory elements within the exon that are important for exon definition. These regulatory sequences, important in both constitutive and alternative splicing, can be broadly defined by their effects on splicing and genomic location. Those located within the exon and promoting exon inclusion are referred to as exonic splicing enhancers (ESEs) and those inhibiting exon inclusion are referred to as exonic splicing silencers (ESSs).
The range of enhancer and silencer sequences recognized by known splicing factors is considerable. This suggests that ESRs may represent numerous functionally distinct binding site classes, or may be recognized in a degenerate fashion. This 'fuzzy' definition of ESRs has meant that their precise characterization has proved challenging.
A large group of existing ESE/ESS sequence datasets exist that have been identified either experimentally (e.g. ESEfinder and Fas-ESS) or through the use of computational approaches followed by some form of experimental verification of a subset of predictions (e.g. RESCUE-ESEs, Ast-ESRs, PESRs and Neighborhood Inference (NI) ESRs).
By carrying out a comprehensive comparison of these different datasets, we found that for most (but not all) ESE datasets SAVs are characterized by losses of ESEs and gains of ESSs. SAVs are also characterized to some degree by a lack of ESE gains. We confirmed this by comparing variants that case increased exon inclusion with hSNPs and found that these variants are characterized by greater numbers of ESS losses and ESE gains.
Of the ESR datasets, we found the Neighborhood Inference set of ESRs from Stadler et al. 2006. was the best at distinguishing SAVs from common polymorphisms. This dataset is represented as a set of 4096 hexamers of which ~24% are assigned as ESEs and ~12% are assigned as ESSs. All analyses in Skippy involving ESEs and ESSs utilize this dataset. A list of the hexamer assignments can be found here.
The Degree of ESR Changes Further Characterize SAVs
The NI dataset is represented as hexamers either because this is often the size of a single protein-binding site (e.g. the GAAGAA ESE), or because they are a reduced representation of larger binding sites. A point variant may therefore modulate several overlapping binding sites simultaneously or an important larger site, and therefore the extent of changes caused by the variant may be an important factor in its functional consequence.
For both ESE losses and ESS gains, SAVs were most strongly characterized by losses or gains of two or more motifs, with the divergence between SAVs and hSNPs becoming greater as the number of changes increases. This is especially true when ESE losses and ESS gains are considered in combination.
LOR (Log Odds Ratio) Score
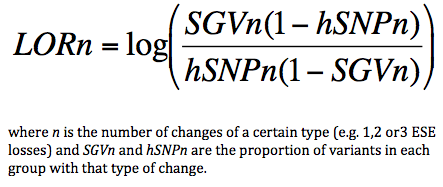
A log odds ratio is a measure of the strength of association of a certain value with one population when compared to another control population. In Skippy we are measuring the strength of association of a certain type of ESR change (e.g. loss of one ESE motif, loss of two ESE motifs etc.) with SAVs versus HapMap SNPs. Negative LORs suggest a change is more associated with HapMap SNPs and positive LORs suggest greater association with SAVs. In Skippy we sum the Log Odds Ratios for three types of ESR changes (ESE loss, ESE gain and ESS gain) to create an aggregate scoring function (although this is not a true Log Odds Ratio for that combination of changes (as we dont have enough datapoints for this)).
The Log Odds Ratio (LOR) for each type of change is calculated:
|
| |
Number of Changes |
| ESR Change Type |
0 |
1 |
2 |
3 |
+4 |
| ESE Loss |
-1.041 |
-0.325 |
0.637 |
0.992 |
1.603 |
| ESS Gain |
-1.306 |
0.03 |
1.268 |
1.452 |
2.012 |
| ESE Gain |
1.063 |
-0.615 |
-1.547 |
-3.537 |
-3.537 |
|
Specific ESR Changes Associated with Exon Skipping
By comparing all possible ESR change types in SAVs compared to those in hSNPs and an expected distribution given the underling distribution of hexamers in the NI-ESR dataset, we identified that in addition to simple loss of ESEs and gain of ESSs, we identified a five-fold increase in the proportion of direct changes from an ESE to an ESS in SAVs compared to both the expected and hSNP distributions (X2 test, P=3.8x10⁻¹²).
ESE→ESS may therefore be a particularly strong indicator of splice-affecting changes.
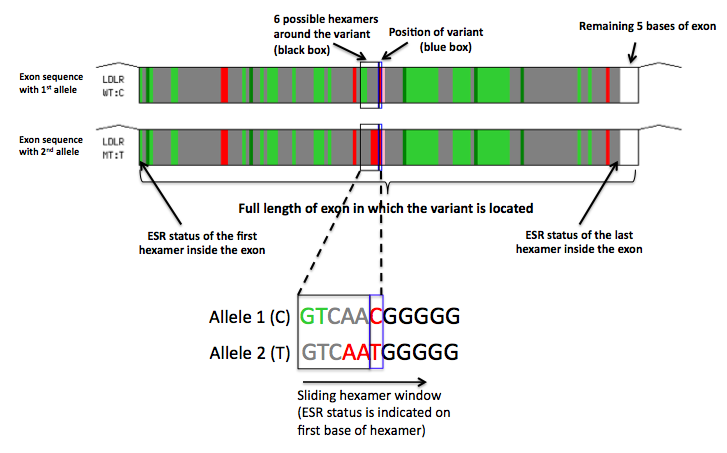
How to Interpret the Exon/ESR Diagram in Skippy Results
Skippy provides a diagramatic representation of the ESR changes within the exonic ESR context. The top exon diagram represents the exon sequence with the first allele and in the bottom exon diagram, the exon sequence with the second allele. The ESR status (ESE/neutral/ESS - according to the NI set) of all overlapping hexamers within the exon is indicated by colors(green/grey/red) going from left to right in the position of the first base of the hexamer (see figure). An uncolored box represents the last 5 bases of the exon.
The region of the exon possibly affected by the variant (all 6 hexamers around the variant) is indicated by a black box. A blue box indicates the position of the variant in the exon.
For all variants located more than 5 bases from the 5' splice site, the hexamer window slides from left to right. For variants located close to the 5' splice site, the hexamer window slides from right to left with the ESR status indicated at the last base of the hexamer, rather than the first. A white empty box representing the first 5 bases of the exon will therefore be seen on the left, rather than the right of the exon.